
This article provides an in-depth overview of key considerations and recommendations for utilizing and interpreting the Jump Scan.
.png?width=688&name=image%20(18).png)
Overview
The Jump Scan is utilized as a standardized assessment of dynamic movement.
The vertical jump is one of the most utilized and well-researched assessments to measure dynamic movement, relative strength, and functional performance.
It has been correlated to everything from strength and athletic performance to injury risk and obesity and provides a simple, reliable assessment with a variety of applications:
Jump Scan Utility
- Baseline Dynamic Movement Assessment or Screening
- Performance (e.g., Strength/Power) Testing
- Occupational Fitness Assessment or Screening
- Physical Therapy/Rehabilitation Testing and Protocols
- Performance/Risk Identification
- Gait Disorder Evaluation/Research
- Fatigue, Performance, and/or Readiness Monitoring
- Movement Disorder Evaluation
- Movement Performance and Injury Risk Research
When to Utilize the Jump Scan
- Fatigue or readiness monitoring
- Athlete monitoring
- Strength & power assessment
- Baseline dynamic or functional movement assessment
- Late-stage lower extremity injury rehab
- Spine, core, and shoulder dysfunction (cleared to jump)
- Concussion/TBI protocol (cleared for exertion)
- Risk identification
- Performance or talent identification
- Movement strategy or compensation identification
Jump Scan Protocol
Ensure the user has performed either a general warm-up or the standardized Sparta Scan Warm Up
- Find and select a user, click on Jump, and click Start Scan
- Follow the prompts on the screen:
- Step on the plate and stand still
- Prepare to jump (arms up), and perform a max effort vertical jump when prompted
- Land back on the plate and stand still
- Continue following prompts until the screen reads, “Scan Complete”
Feel free to download and print the Scanning Instructions PDF
Check out the Scan Protocols article for more in-depth guidance, including a video.
Primary Jump Scan Biomarkers
Sparta Score
Sparta Score is derived from their Jump Scan and represents an individual’s dynamic movement efficiency. Higher scores indicate higher efficiency.
The Sparta Score is a composite score based on the three Signature scores of Load, Explode, and Drive (more below). The Sparta Score rewards higher magnitudes and more balanced or similar values for Load, Explode, and Drive. These three scores represent an individual’s ability to Create, Transfer, and Apply force in dynamic movement.
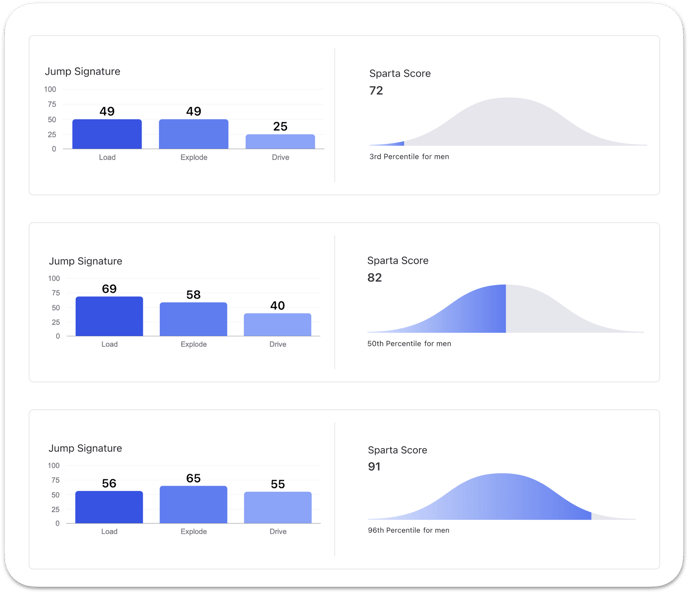
The visual above gives an example of three different Sparta Scores and their corresponding Signature scores. As you can see, the result with the highest magnitude and relative balance has the highest Sparta Score (91). Meanwhile, the middle result has one Signature score higher than the user on the bottom (Load of 69), but since there is an inefficiency in how low Drive is (40), they have a lower Sparta Score (82).
Signature Scores: Load, Explode, and Drive
Load, Explode, and Drive represent an individual’s ability to Create, Transfer, and Apply force in dynamic movement.
Load
Load represents how well an individual initiates movement. It captures the stand-to-squat phase of the jump or the eccentric phase. It is highly influenced an individual's ability to “triple flex” and decelerate- utilizing their ankles, knees, anterior chain, and quad strength.
Explode
Explode represents how well an individual can transition movement. It captures the transfer from the bottom of the squat up, or the concentric phase. It is highly influenced by an individual’s relative strength, reactiveness, and core strength.
Drive
Drive represents how well an individual can finish a movement. It captures the squat to the point of take-off or the concentric phase. It is highly influenced by an individual’s movement timing, active range of motion, flexibility, and posterior chain strength.
Asymmetry Scores: Jump Shift
Jump Shift represents the lateral shift of movement during loading. Higher values indicate a larger lateral shift. The more an individual shifts to one side during the down phase of the jump, the higher value they’ll receive.
 Classification Models: Risk (configuration required)
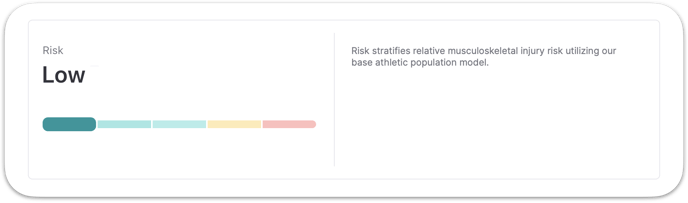
Risk is derived from the Jump Scan and stratifies relative musculoskeletal injury risk utilizing our base athletic population model. The classification model assigns one of five Risk groups, ranging from low, to average, to high Risk. Risk is generally only configured for relevant populations.
Normalized Results Interpretation
Sparta Score
Sparta Score is presented as a composite score derived from Load, Explode, and Drive.
A score of 82 is the population average, with typical scores ranging roughly between 78-86 for women and 77-87 for men, meaning the majority of users score within a 4-point (female) or 5-point (male) range from the average of 82.
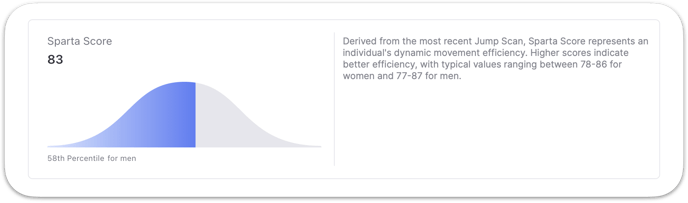
The population average for Sparta Score is 82, with typical scores ranging between 78-86 for women and 77-87 for men.
Approximately a 2-point change in Sparta Score is considered significant and highlighted within the software.
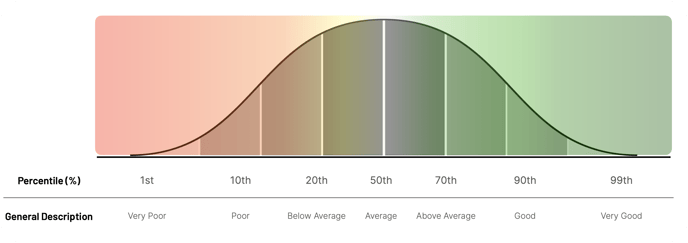
Sparta Score is also represented as a percentile to improve interpretation. This normalization also can provide context relative to specific cohorts (e.g., age, sex at birth). See the image below for a visual representation of these scores.
Load, Explode, and Drive
Load, Explode, and Drive are all contextualized into T-score values, where 50 is equal to the mean or average. Higher scores indicate greater force production. Anything higher than 50 is above average, and anything lower than 50 is below average.
Typical scores for the cohort or population range from 40-60, meaning the majority of users in that group score within a 10-score range (1 standard deviation) from the average of 50.
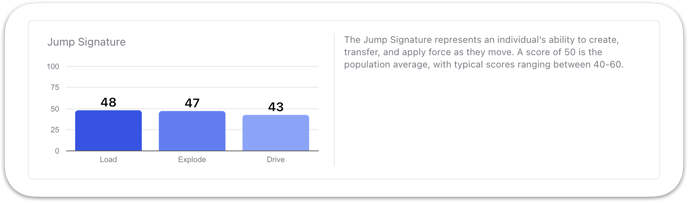
Typical scores for the cohort or population range from 40-60.
Approximately a 4-point change in Load and a 3-point change in Explode and Drive is considered significant and highlighted within the software.
Jump Shift
Jump Shift scores are all contextualized into adjusted T-scores, where 0 represents the mean or average. Higher scores indicate greater asymmetry between limbs. Scores also include an L or R to represent which the user is favoring during the down phase of the jump.
Typical scores range from 0-10 on either side, meaning the majority of users score within a 10-score range (1 standard deviation) from 0. Small variations within this range on either side are common in people subjected to repeated testing and are typically not significant. Scores greater than 10 on either side can be considered atypical.
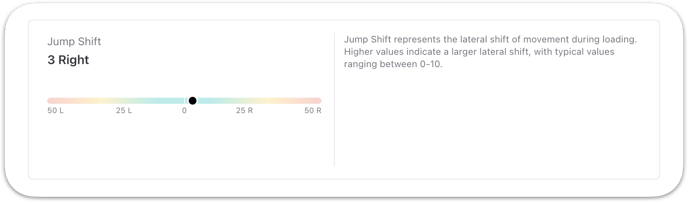
Typical scores range from 0-10 on either side.
Scores greater than 10 on either side can be considered atypical and warrant further investigation and assessment.
Explaining the Results
Movement is an important vital sign, and though most commonly used for specific use cases such as injury rehabilitation and athletic performance, the utility of jump assessment encompasses all of Movement Health.
What?
“The Jump Scan measures how you move dynamically- your movement strategy. The different scores represent different components of movement. The more efficiently you move, the higher your Sparta Score will be.”
How?
“The force plate is accurately measuring the forces you put into the ground, while the software analyzes and compares the data to the population to provide insights into your dynamic movement efficiency. This allows us to understand how your movement compares to people similar to you.”
Why?
“The information this provides allows us to identify potential inefficiencies in your movement. It also allows us to compare your movement and relative strength to others; for example, is it at, above, or below average? Additionally, this allows us to track your movement and performance longitudinally over time and monitor any progression or regression.”
Additional Resources
- Vertical Jump Testing - Literature and Rationale
- Scan Protocols
- The Jump Scan
- What is being measured during the Jump Scan?
- Load, Explode, and Drive - The Jump Scan
- Movement Focus Classifications - The Jump Scan
- Normative Data in the Sparta Movement Health Platform
- Movement Panel Metrics (additional raw and normalized metrics)
- Sparta Science Academy - Free Online Training