
A large variety of force-time derivatives (eg. mass, acceleration, velocity, power, impulse) can be calculated from time-series data. This article provides a general explanation of what is being measuring during Jump Scans
Force Plates
A Force Plate or platform is a device used to measure the forces exerted on the ground by a human body. Force plates can be thought of as high-powered bathroom scales because the devices themselves are relatively simple. The force plate device is instrumented with load cells that convert a force, such as pressure, into an electrical signal that can be measured and standardized. As the force applied to the load cell increases, the electrical signal changes proportionally.
Read More: Force Plate Technology
Data Types
Our data model describes the different levels of data that can be calculated utilizing the force plate, but at the simplest level, a force plate is designed to measure forces over a period of time. These two variables (force and time) are measured directly, and can then be utilized to calculate a variety of different metrics or variables.
Read More: What types of data does Sparta provide?
Jump Scans
The below visual shows a generic Jump force-time curve illustration generated by plotting the resultant vertical force data over time (time-series data). Specific phases and points of interest are labeled above to allow for a more technical explanation but also a more clear understanding of what these measures are and how it relates to what they represent and the trends we see.
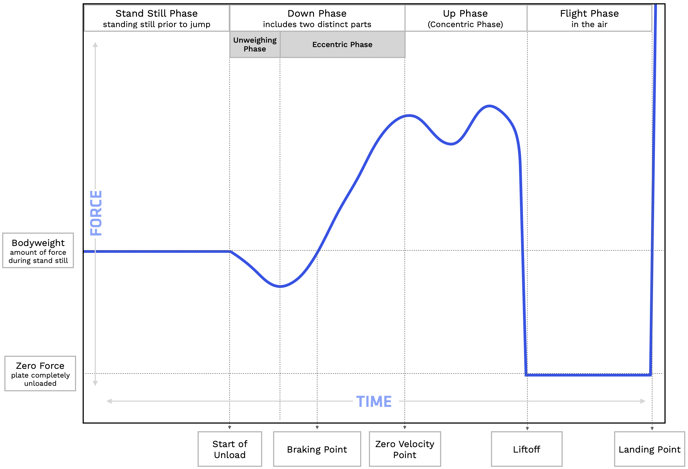
The system resolves the sensor data into time-series representations of resultant vertical force (Fz) and center of pressure measures in the plane of the plate (COPx and COPy) representing medial-lateral and anterior-posterior directions respectively. When a person attempts to jump, capture and analysis of this time series data can reveal key insights into the person’s movement strategies and capabilities. Analysis, here, consists of reducing the millions of individual Fz, COPx, & COPy measurements down to a small set of distinguishing features or variables.
Though the Sparta Movement Health Platform calculates many individual features for jump (> 40), three key metrics and a summary metric are chosen that concisely characterize a person’s movement capabilities: Load, Explode, Drive, and Sparta Score.
The additional Movement Panel (raw) metrics that show in the Sparta Movement Health Platform contain a brief description/definition that can be pair with the above visual to best understand how the calculations are performed. The terms we use are specific and consistent with the SMHP.
Read More: