
The Sparta Score provides a convenient single metric to assess dynamic movement efficiency. Based on Load, Explode, and Drive, this metric captures multiple aspects of dynamic movement.
Sparta Score: dynamic movement efficiency
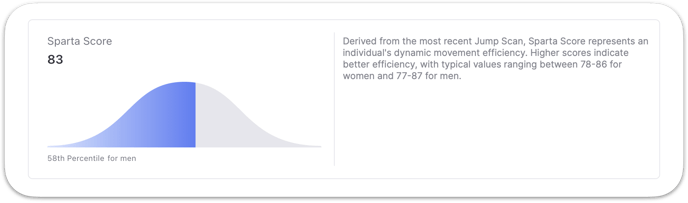
The Sparta Score is a composite metric derived from Load, Explode, and Drive, rewarding high magnitudes of force production and balanced, or efficient, Jump Signatures. These two concepts are desired as they represent greater dynamic movement efficiency. Sparta Score values typically range between 78-86 for women and 77-87 for men, with age-based percentiles reported to provide context for interpretation.
The Sparta Score will increase as a byproduct of improving each individual’s lowest metric. When targeted training (and sufficient recovery) takes place, Load, Explode, and Drive should increase in magnitude but also ideally become more balanced yielding improvements in health and performance. Therefore, using your Sparta Score as a reference point is a great way to see trends, both positive and negative.
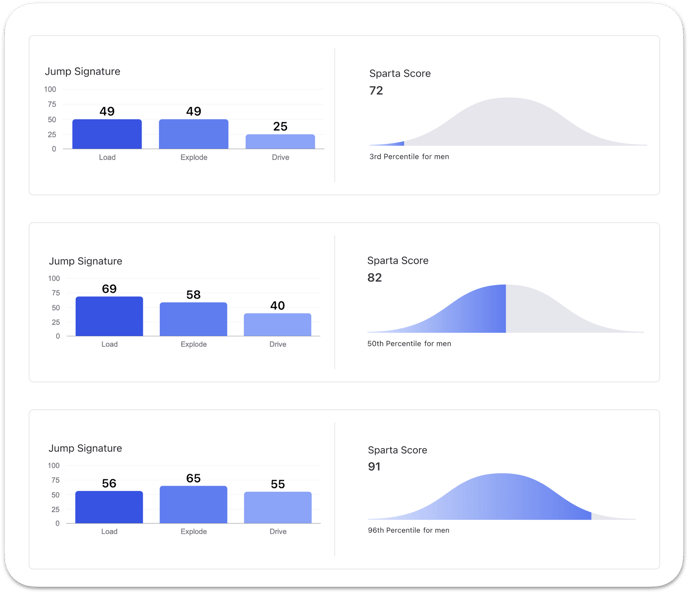
The visual above gives an example of three different Sparta Scores and their corresponding Signature scores. As you can see, the result with the highest magnitude and relative balance has the highest Sparta Score (91). Meanwhile, the middle result has one Signature score higher than the user on the bottom (Load of 69), but since there is an inefficiency in how low Drive is (40), they have a lower Sparta Score (82).
Why the Sparta Score?
Initially, we were very hesitant to develop a single score as we were concerned with whether or not that single number would be useful or trusted, but after consistent feedback from customers, the Sparta Score was eventually developed. This one single number allows for a few key benefits when compared to looking at the full spectrum of data that can be provided by the Jump Scan:
1. It allows us to easily rank individuals and create thresholds for further investigation. For example, some of our partners utilize specific cutoffs to further evaluate individuals who fall below those thresholds.
2. It allows for better motivation for individuals to improve and focus on movement quality.
Instead of having multiple numbers to understand, an individual end-user can easily interpret and relate to a higher total score being better, even if that means a single value may have gone down. For example, in the graphic at the top, if an individual's Load decreased from 69, they may view that as bad, but if it creates a more efficient mover, it is actually good! We wholeheartedly support the notion that movement and Movement Health are extremely complex; however, the Sparta Score has proven a useful metric in our pursuit of supporting real-world organizations to improve and optimize outcomes.
What is a good Sparta Score?
The population average Sparta Score across our entire database is around 82. With the Sparta Score, in general, a higher score is better.
The population average for Sparta Score is 82, with typical scores ranging between 78-86 for women and 77-87 for men, with higher values representing better dynamic movement efficiency.
Beyond understanding what the average and typical range of scores are, age-based percentiles are also reported to provide context for interpretation. For example, a score in the 50th percentile for your age and gender represents an Average score, while scores in the 85th percentile could be considered Good.
It is important to note that what is "good" often needs to be interpreted within the context of the cohort or population. As the percentiles can be compared to different cohorts (e.g., elite athletes or general population), be sure to understand the context of comparison when interpreting scores.
Learn More: Utilizing and Interpreting the Jump Scan