This article provides a high-level overview of key considerations and recommendations for assessing limb symmetry, including a discussion of the current literature and guidance for Sparta Movement Health Platform users.
Overview
Limb asymmetry, often also discussed as interlimb asymmetry, is a comparison of movement function or performance (e.g. strength) between right and left anatomical limbs, often presented as a percentage of one limb to the other (5). Limb asymmetry is of interest in healthy populations for assessing functional (i.e. typical or normal) and dysfunctional (i.e. atypical) asymmetries, as well as in injured populations for comparing affected and unaffected limbs during rehabilitation and continuous monitoring.
It is generally accepted that a large asymmetry between the function or performance of limbs can be considered a detriment, however, the literature investigating the influence of asymmetries on risk and performance is conflicted (6,8,9).
Therefore, the assessment and interpretation of limb asymmetry should be undertaken within the context of the type of test, the individual, and other relevant contextual information.
Measuring Single-Limb Function
Limb asymmetry is often assessed utilizing quantifiable functional single-limb tests of performance. For example, a maximum effort single-leg hop for distance test is often utilized as a part of rehabilitative testing (1). Additionally, more isolated assessments are often utilized, such as single joint isokinetic dynamometry, to objectively assess single-leg strength (e.g. knee extension) (9). The assessment of single-limb function is not restricted to tests of strength; tests of balance, range of motion, and joint stability are other assessments that are commonly utilized to assess single-limb function and quantify asymmetry.
Depiction of 4 single leg hop tests commonly used: a) single hop for distance, b) triple hop for distance, c) cross-over hop for distance, d) 6-m timed hop (13).
Single-limb function is typically assessed in unilateral (single-limb) tasks, but more recently the use of bilateral (double limb) tasks or tests capable of quantifying single-limb function, preference, or contribution is of interest (8). Bilateral tasks can be utilized to quantify single-limb function by either utilizing separate sensors (e.g. force plates, accelerometers) for each limb, or utilizing a single sensor capable of quantifying single-limb function (e.g. single camera kinematics, force plate posturography).
Multiple systematic reviews of the literature report the task or test-specific nature of single-limb functional tests, as well as highlight the effect of natural human movement variability on test results (6,9,10).
Practically speaking, an individual may show inconsistent results for which limb is “stronger” based on two different tasks or tests (e.g. bilateral squat and single leg jump) and, due to natural human variability, results can also be inconsistent within the same test. To address task-specificity, and as there is no consensus on the optimal test, a “battery” of multiple tests is most often recommended and used in practice. Additionally, it is important that tests and test results are interpreted properly so clinicians can distinguish between “the signal” and “the noise” due to natural human variability (11). For example, an asymmetry of 5% should only be considered “real” if the natural variability for the asymmetry test result is less than 5%. Various methodologies can be utilized to address this concern, and choices should be optimized for accurate and intuitive interpretation.
Many single-limb tests of balance, range of motion, strength, and stability are used in clinical practice as assessments of limb function and are often utilized to quantify limb asymmetry for risk identification, performance enhancement, and rehabilitative purposes. These different tests are continuously evaluated by practitioners, clinicians, and researchers and their use in clinical and operational practice continue to evolve. Clinicians tend to prefer tests that can be described as “functional,” meaning that they assess or mimic real-world functional movement patterns (walking, running, hopping, jumping) as more valid indicators of rehabilitation progress and functional performance. Tests that most commonly find themselves in use, are praised for being simple, intuitive, inexpensive, and “clinically useful.” Best practice also encourages that tests are reliable (accurate and consistent) and valid (measure useful/relevant information) for their inclusion in clinical practice. Additional important considerations are below, discussing the various calculations available to quantify limb asymmetry and their application.
Quantifying Limb Asymmetry
In addition to a variety of options for measuring single-limb function, there are a variety of ways to calculate or derive measures of symmetry or asymmetry based on the results of single-limb functional tests. The term Limb Symmetry Index (LSI) is commonplace in both the literature and clinical practice and refers to various calculations performed on single-limb functional tests to derive a single metric to quantify asymmetry.
Perhaps the most common calculation for LSI (displayed below) results in a percentage, with 100% being reflective of high symmetry, with lower values representing less symmetry between limbs. In clinical practice, an LSI of 90%, or 0.90, is often referenced as a key threshold for comparing the function of a healthy limb with an ‘affected’ or injured limb during rehabilitation.
Example: Triple Hop Test for Distance
| Unaffected Limb | Affected Limb | |
| Trial 1 | 26.5 cm | 22.5 cm |
| Trial 2 | 27 | 25 |
| Trial 3 | 28.5 | 25 |
| Average | 27.33 | 24.17 |
Limb Symmetry Index (LSI) =
[affected limb (avg score) ÷ unaffected limb (avg score)] x 100
LSI = [24.17 ÷ 27.33] x 100 = 88%
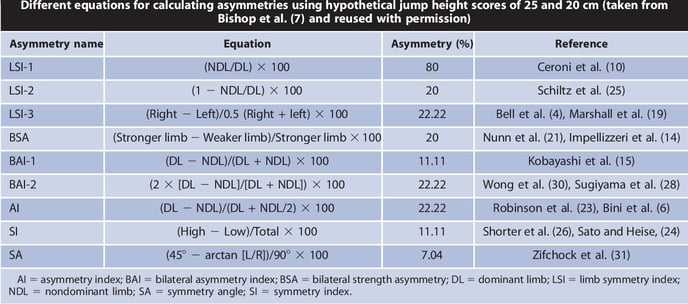
Recent research has however challenged the clinical relevance of this global threshold. As different calculations utilized for LSI on the same test results can result in different indices of asymmetry (see image below) based on underlying mathematical assumptions, this literature has highlighted the necessity to provide rationale and guidelines for selecting calculations for a specific test and interpreting results for clinical use. Researchers also highlight the loss of asymmetry direction information (e.g. right or left) and the use of the opposite limb as a reference as additional limitations of existing calculations and clinical utility.
Different equations for calculating asymmetries (7).
An in-depth review of the calculations and their underlying assumptions is beyond the scope of this article, but additional resources are provided in the references (7,8,9,12).
In summary, it is important that considerations are made for selecting the optimal asymmetry calculation based upon the assessments utilized and data collected, and guidelines are provided for interpretation.
Sparta Scans and Results to Assess Limb Asymmetry
The Sparta Scan Kit can be utilized to assess limb asymmetry with both the Balance and Jump Scan protocols. One high-level metric from each assessment has been optimized for accuracy and utility, providing both asymmetry magnitude and direction to enable accurate and intuitive limb asymmetry monitoring in both healthy and injured populations.
Balance Scan
The Balance Scan consists of a series of single-leg balance trials and is utilized to assess balance, stability, and proprioception. While the assessment captures a variety of different metrics, Balance Asymmetry has been highlighted and developed to best represent asymmetry in balance capabilities.

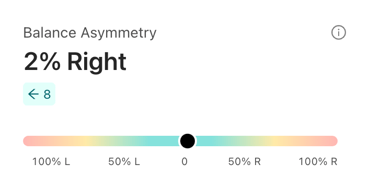
Balance Asymmetry: asymmetry of balance from side-to-side
Balance Asymmetry is displayed as a percentage of relative asymmetry based on the Balance value for each limb. Values for Balance Asymmetry typically range between 0% and 20% with higher asymmetry values reflecting greater asymmetry between limbs. Small variations in Asymmetry are common in people subjected to repeated testing and are typically not significant. Also, some people may exhibit high asymmetry due to known non-correctable issues such as pre-existing injuries.
There are cases, however, where subjects are unknowingly compensating with a better side, and where high asymmetry may reveal opportunities to improve overall balance capabilities. Context knowledge of the subject is therefore important in using asymmetry information.
Jump Scan
The Jump Scan consists of a series of bilateral vertical jumps and is utilized to assess dynamic movement strategy and function. While the assessment captures a variety of different metrics, Jump Shift has been highlighted and developed to best represent jump asymmetry.

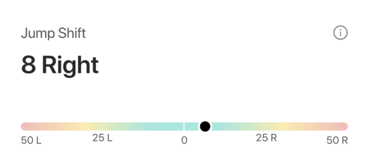
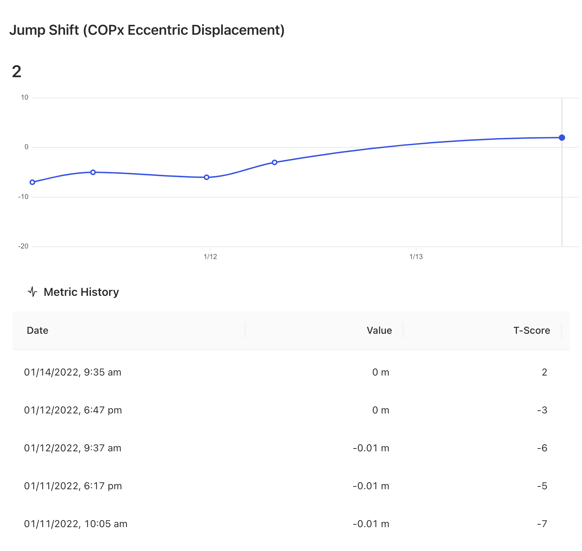
Jump Shift - magnitude of lateral shift during loading (eccentrically)
Jump Shift is displayed as an adjusted t-score that reflects the magnitude of lateral shift during the jump. Measured during the down phase of the jump, Shift reflects how far an individual’s center of pressure (CoP) shifts laterally toward a “preferred” side/limb to start a movement. Values for Jump Shift typically range between 0 and 10 with higher values reflecting greater asymmetry. Small variations in Jump Shift are common in people subjected to repeated testing and are typically not significant.
There are cases, however, where subjects are unknowingly compensating with a better side, and where high Jump Shift may reveal opportunities to improve overall movement function. Context knowledge of the subject is therefore important in using asymmetry information.
Utilizing Asymmetry Results
Because of the complexity and variability of human movement, asymmetry information should be interpreted and utilized within the context of the individual. As mentioned previously, the literature investigating the influence of asymmetries on risk and performance is conflicted. While it may be tempting to assume that asymmetries should be addressed, many key factors can influence asymmetry results:
- Natural human movement variability
- Natural limb preference or limb-dominance (e.g. right-handed)
- Necessary specialization (e.g. sport-specific)
- Pre-existing injury
Consistent and frequent assessment of limb asymmetry utilizing both the Balance Scan and the Jump Scan provides practitioners with the ability to monitor both the magnitude and direction of asymmetry. Understanding the typical values for Balance Asymmetry (0-20%) and Jump Shift (0-10) provides relevant benchmarks for practitioners to identify atypical asymmetry in healthy populations for further investigation or increased assessment frequency for monitoring.

The Movement Health Platform enables practitioners to visualize longitudinal data for individuals to identify trends. This allows for consistent monitoring of progression or regression through different stages of rehabilitation in injured populations.
Additional Resources
- Utilizing and Interpreting the Balance Scan
- Utilizing and Interpreting the Jump Scan
- Data Normalization in the Movement Health Platform
References:
- Meylan, Cesar, et al. "Single-leg lateral, horizontal, and vertical jump assessment: reliability, interrelationships, and ability to predict sprint and change-of-direction performance." The Journal of Strength & Conditioning Research 23.4 (2009): 1140-1147.
- McElveen, Michael T., Bryan L. Riemann, and George J. Davies. "Bilateral comparison of propulsion mechanics during single-leg vertical jumping." The Journal of Strength & Conditioning Research 24.2 (2010): 375-381.
- Nagai, Takashi, et al. "Hop tests can result in higher limb symmetry index values than isokinetic strength and leg press tests in patients following ACL reconstruction." Knee Surgery, Sports Traumatology, Arthroscopy 28.3 (2020): 816-822.
- Wellsandt, Elizabeth, Mathew J. Failla, and Lynn Snyder-Mackler. "Limb symmetry indexes can overestimate knee function after anterior cruciate ligament injury." journal of orthopaedic & sports physical therapy 47.5 (2017): 334-338.
- Bishop, Chris, et al. "Interlimb asymmetries: The need for an individual approach to data analysis." The Journal of Strength & Conditioning Research 35.3 (2021): 695-701.
- Bishop, Chris, Anthony Turner, and Paul Read. "Effects of inter-limb asymmetries on physical and sports performance: A systematic review." Journal of sports sciences 36.10 (2018): 1135-1144.
- Bishop, Chris, et al. "Asymmetries of the lower limb: The calculation conundrum in strength training and conditioning." Strength & Conditioning Journal 38.6 (2016): 27-32.
- Bishop, Chris, et al. "Interlimb asymmetries: Understanding how to calculate differences from bilateral and unilateral tests." Strength & Conditioning Journal 40.4 (2018): 1-6.
- Parkinson, Amy O., et al. "The Calculation, Thresholds and Reporting of Inter-Limb Strength Asymmetry: A Systematic Review." Journal of Sports Science & Medicine 20.4 (2021): 594.
- Guan, Yanfei, et al. "Association between inter-limb asymmetries in lower-limb functional performance and sport injury: a systematic review of prospective cohort studies." Journal of clinical medicine 11.2 (2022): 360.
- Bishop, Chris. "Interlimb asymmetries: Are thresholds a usable concept?." Strength & Conditioning Journal 43.1 (2021): 32-36.
- Queen, Robin, et al. "A novel method for measuring asymmetry in kinematic and kinetic variables: the normalized symmetry index." Journal of biomechanics 99 (2020): 109531.
- Davies, William T., Gregory D. Myer, and Paul J. Read. "Is it time we better understood the tests we are using for return to sport decision making following ACL reconstruction? A critical review of the hop tests." Sports Medicine 50.3 (2020): 485-495.

