
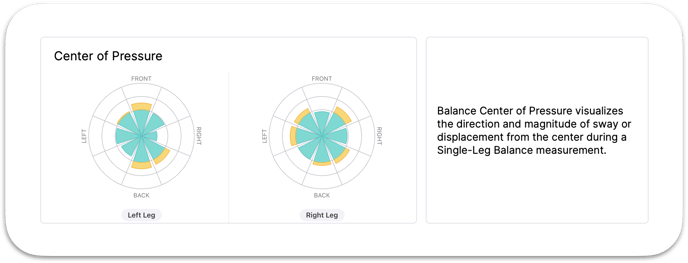
Center of Pressure visualizes the direction and magnitude of sway or displacement from the center during a single-leg Balance Scan.
Coming Soon!
Balance is measured during a single-leg stance and represents an individual's advanced functional balance capabilities. The Center of Pressure chart visualizes the center of pressure on the left and right sides during the Balance Scan.
Center of Pressure
Center of Pressure provides a visual reference of the “sway” or displacement occurring during the single-stance, which is part of the Balance and Progressive Balance Scans. During a single-leg stance, individuals will typically display a measurable amount of movement or sway in different directions to control balance and ensure an individual is able to stay upright. Some amount of movement is necessary and can represent a properly functioning balance system. However, a larger relative amount or area of displacement can be representative of injury or dysfunction and may be worth monitoring or further investigation.
Interpreting the Chart
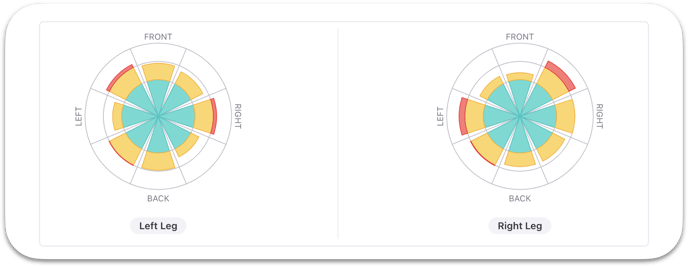
The Center of Pressure charts show two radial or circular bar charts, one for each side. The charts are divided into eight sections, with wedges in each of those sections that represent both the direction and magnitude of movement. The chart can be interpreted anatomically, with wedges labeled Front and Back, representing movement in anterior and posterior directions, respectively. Similarly, wedges labeled Left and Right will represent either medial (toward the body center) or lateral (away from the body center) movement, depending upon the side.
The position of the wedge represents the direction of movement, and the size of the wedge represents the magnitude of movement, with a larger wedge reflecting larger displacement in that direction.
While the Balance scores (and other additional metrics) are useful for quantifying balance capabilities, Center of Pressure is best utilized to understand the direction and magnitude of movement that occurs during the single-leg stance.
The Balance score best reflects balance performance and should be utilized for interpretation, while Center of Pressure provides additional information on balance strategy.
 Interpreting the Colors
The coloring on the charts is utilized to reflect how the individual’s sway or movement compares to our normative database. This normalization helps to provide context and improve interpretation for both practitioners and users. The three colors, green, yellow, and red, represent Low, Medium, and High amounts of displacement, respectively. Wedge colors are stacked to allow for a visual representation relative to norms. Wedges within the green-colored layer represent displacement less than or equal to the population average.
Displacement magnitude is represented by wedge colors, with green, yellow, and red layers representing low, medium, and high amounts of displacement, respectively.
Learn More: Utilizing and Interpreting the Balance Scan