
This article discusses using the cohort capability, which utilizes subpopulation data to provide relevant normalization and context to improve metric interpretation.
Overview
One powerful capability of Sparta Science’s human data platform is leveraging large quantities of population-level data to provide context and reference to improve the utility and interpretation of your data. In addition to the raw values for metrics, normalized values, which adjust metrics to a standard scale to ease interpretation and understanding, are also often available. The result of this normalization process transforms raw measurements into t-scores and percentiles, providing typical ranges for metrics to improve interpretation and usefulness.
Read Population Statistics and Normalization to learn about t-scores, percentiles, normalization techniques, and general interpretation guidelines.
The Cohort capability analyzes this depth and breadth of data, performing relevant population statistics to available subpopulations (or cohorts) to show where users' metrics fall relative to various more specific groupings in real-time.
Available cohorts
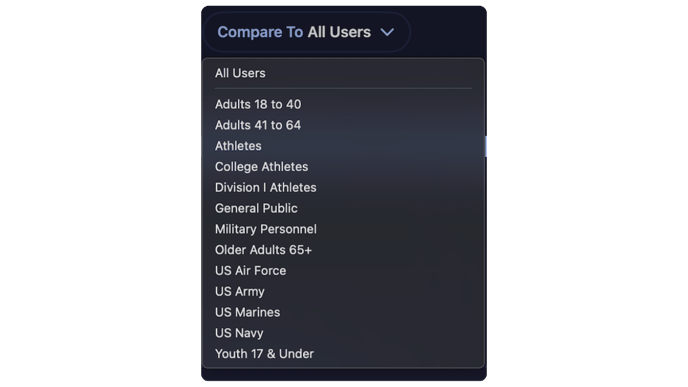
The broadest level of normalization available is the cohort ‘All Users,’ which utilizes the entire population of data within our platform to normalize values for female and male users. This is often selected as the default cohort (see below). This level of normalization is available where there is a sufficient quantity and quality of data for a large enough population.
Cohort normalization capabilities are available where there is a sufficient quantity and quality of data to apply population statistics to a specific cohort and observation type of interest. Some currently available cohorts include various age groupings, athletic, military, senior, and general public populations.
Contact your Customer Success Manager to discuss available cohorts for your data sources!
Default cohort selection
When a cohort is set as the default, all scores within that ecosystem of applications—including Results, Dashboards, Reports, and the Users Tables— and the starting state for the user-based views (e.g., User Profiles) will be normalized to that cohort. The default cohort may be initially set to ‘All Users.’
It is possible to change the default scores for your organization to be calculated in terms of the chosen cohort instead of the 'All Users' cohort. If this is desired for your organization, don't hesitate to contact your Customer Success Manager to discuss available cohorts and other implications for changing the default normalization approach. Once a default cohort is selected, additional cohorts can be enabled by your Customer Success Manager.
How do cohorts work to compare users?
The default cohort normalizes available data and provides scores and normative results as the default behavior. Users will have raw data, normalized scores, and percentiles based on the default cohort.
If an administrator selects an alternate cohort from the dropdown menu, additional cohort-specific information will display, highlighting typical ranges for the alternate cohort selected, as well as percentiles based on the alternate cohort. The scores themselves (typically t-scores) will remain normalized to the default cohort to ensure that metrics and scores are stable for longitudinal monitoring, reporting, and analysis.
A user’s scores will not change when a new cohort is selected; instead, percentiles will be updated relative to the alternate cohort, and cohort-specific typical ranges will be shown. This allows users and administrators to interpret results using cohort-relevant context while ensuring that user scores are stable regardless of the alternate cohort selected.
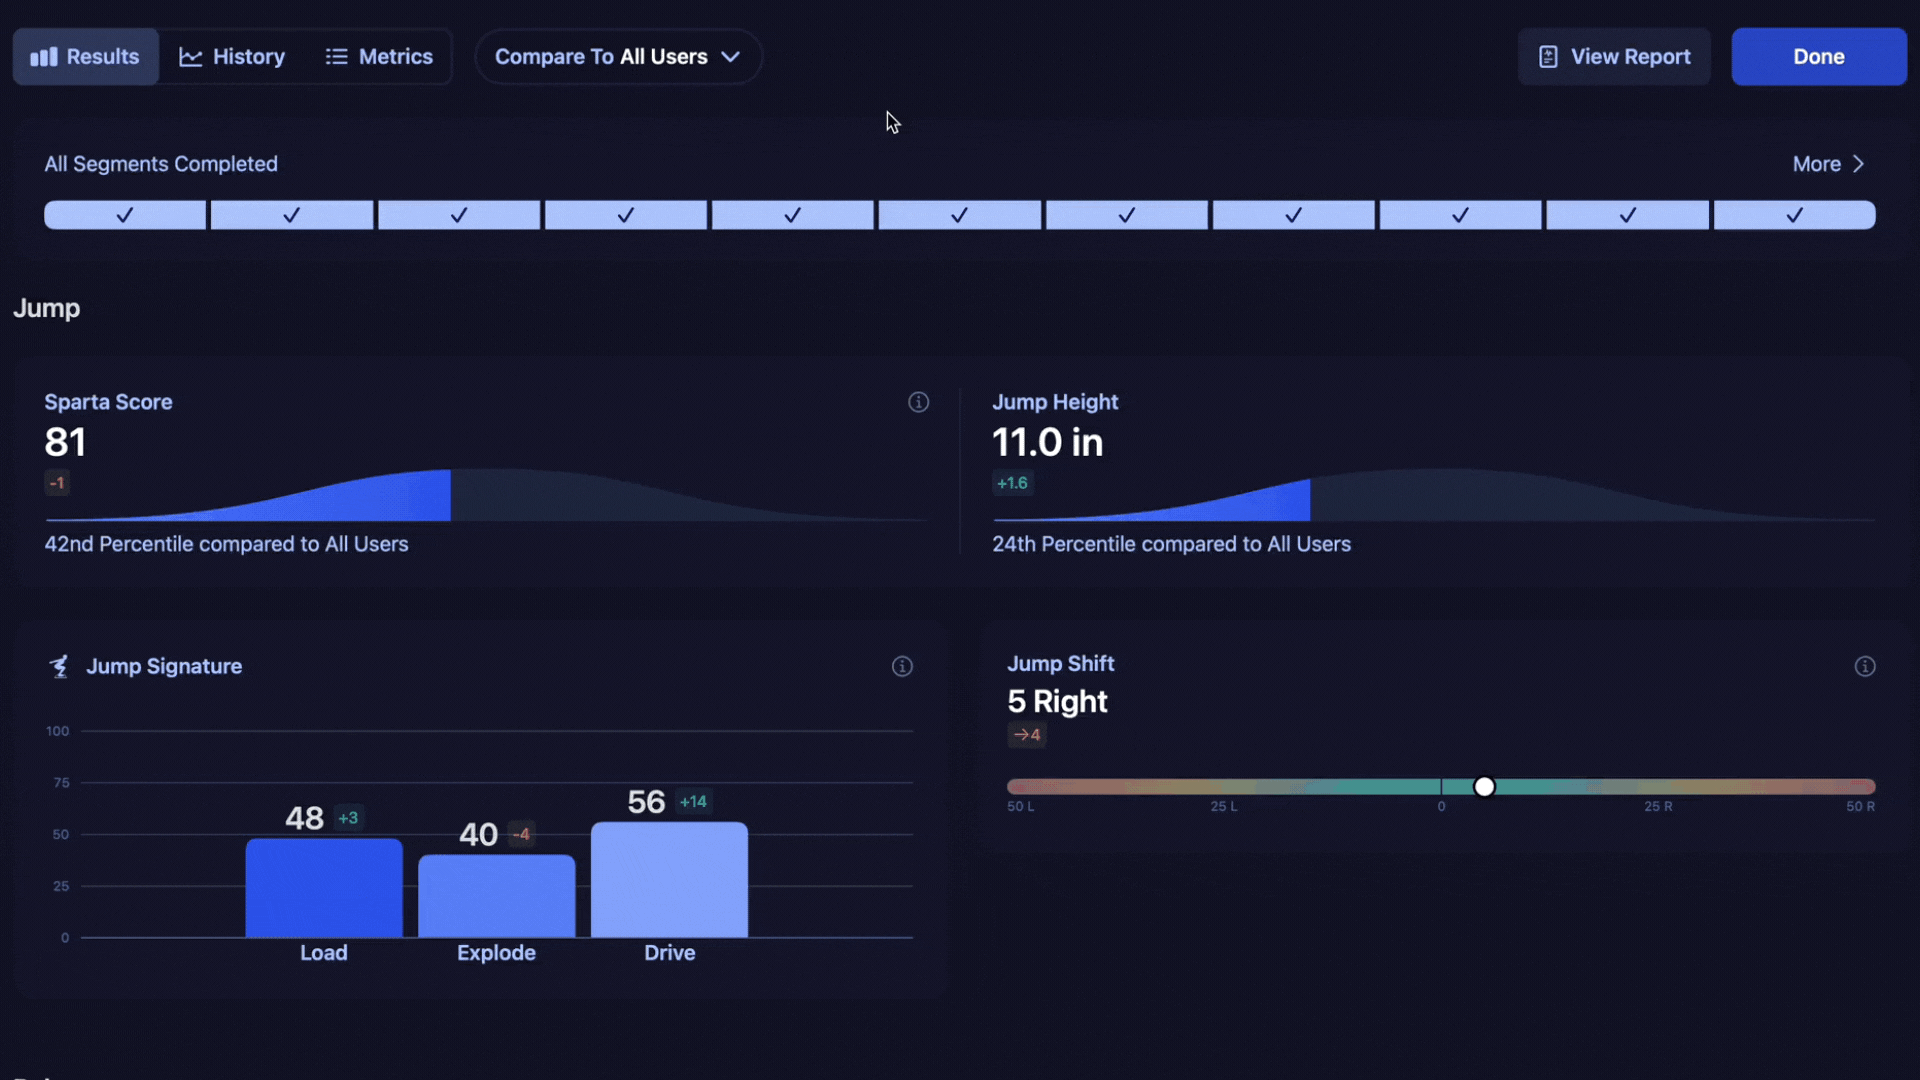
In the example above, the default cohort selected is ‘All Users.’ We can see the raw Jump Height value of 11.0 inches. Compared to the default cohort, that score is at the 24th percentile for all (female) users. By changing the cohort from ‘All Users’ to ‘Athletes, we are now comparing the results to a smaller cohort that includes high school, collegiate, and professional athletes. In the context of (female) athletes, this user's normative score changes to the 21st percentile.
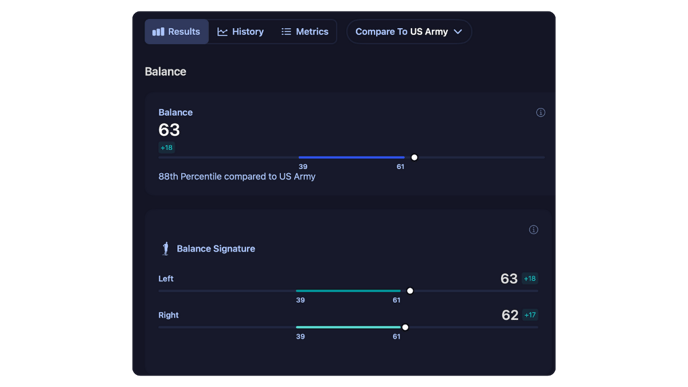
Note: All cohorts currently consider sex at birth for normalization, meaning scores for male and female users are normalized to other male and female data, respectively, based on their profile information.
Where can I compare to a cohort within the software?
Comparing a user to a given cohort is as easy as toggling a dropdown from the User Profile, Metric Details, or Scan Details pages within the Management Console. For organizations utilizing the Scan App, cohorts can also be selected on the Results Screen. These dropdowns display all cohorts enabled for your organization. Contact your Customer Success representative to enable more or inquire about other available cohorts.
When a cohort from this dropdown is selected, the charts on the screen will update to show the typical range for the cohort. The cohort dropdown currently only applies to the user-based views; Dashboards, Reports, and the Users Tables do not have the functionality to toggle between cohorts.
Additional Resources