
Learn more about the concept of reliability and its foundational importance for data integrity.
pre·ci·sion /prəˈsiZHən/
noun: the quality, condition, or fact of being exact and accurate.
Introduction
The two most important aspects of data collection are reliability and utility. Reliability is measuring something consistently (reproducibility) and when it comes to reliably assessing human movement, it is most important for tracking changes WITHIN individuals. Utility/usefulness is a more broad concept that essentially means there is some inherent value in this data to allow us to gain insight or take action. A basic type of utility may be validity, which is some measure of association of the data with another measure, answering the question, "How well does the data, measure what it's supposed to?“ Validity is important for distinguishing BETWEEN individuals, as there is definitely utility in being able to determine different characteristics between different individuals and cohorts. It is important to understand that reliability is a precursor to utility. That is, if the results of a test cannot be assigned consistently (reliable), it is impossible to conclude that the scores can have any sort of utility or usefulness for the stakeholders or individuals of interest.
Step 1: Are our measures reliable?
Reliability is the ability to get the same results with the same measurements consistently. For example, if I step on and off a scale multiple times, a reliable scale will keep giving me the same number. Reliability is often assessed utilizing some sort of test-retest correlation. So in the example we just discussed, I first perform a test: my initial weigh-in on the scale, say 220.8. Then I perform the retest (often on a different day) getting another data point for my new weight, for example, 222.1. If we do this a large enough number of times with a large enough population of people we can use this data to analyze if the scale itself is reliable. Obviously, a reliable scale should give us a similar value each time we step on it.
We can utilize a few different statistical tests that will give us a specific measure of how reliable this scale is. A couple of examples of measures these tests produce are Cronbach’s Alpha and Intraclass Correlation Coefficient, with both falling somewhere between 0 and 1. The closer to 1 the better with anything below 0.5 usually deemed as being unreliable.
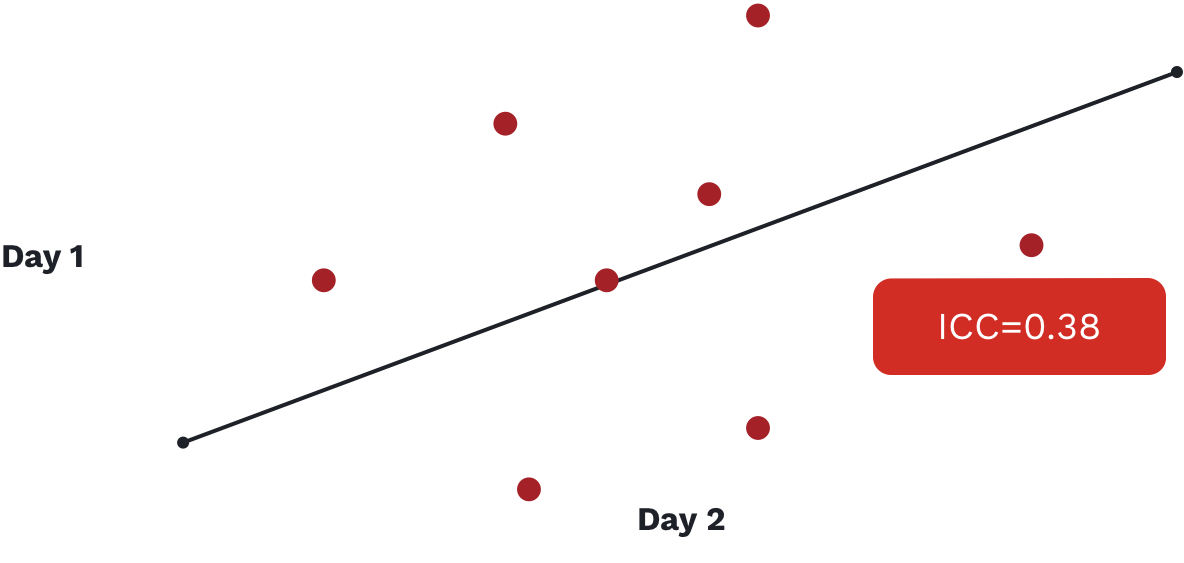
In the above image, we see an ICC value reported for a commonly used movement screen that is well below the accepted range of what we would deem a reliable test (1). It is an important example to show as this screen is extremely popular and continues to be utilized in a variety of organizations from hospitals focused on health and wellness to elite sporting organizations looking for that extra 1%, despite its lack of reliability.
To reiterate the importance of reliability... Remember if the results of a test cannot be assigned consistently (reliable), it is impossible to conclude that the scores accurately measure the domain of interest.
Basic Reliability
- Chances that a measure will produce a similar result when repeated under similar conditions (repeatability)
- “Error” in repeatability can be due to the individual or the technology
- Represented by some form of test-retest correlation (1.0 = 100% chance of a similar measure and 0.0 = a 0% chance of a similar measure) – Example: intraclass correlation coefficient (ICC = 0.85)
Reliability is often overlooked because it isn’t sexy, but is it of the utmost importance. It is also important to understand that we need to evaluate the reliability of each unique test, metric, measure, or variable we are collecting and hoping to use. To use an example familiar to us, the literature the vertical jump is often cited as being a reliable test and force plates are often cited as being reliable measuring devices... but it really isn't that simple. Reliability is specific: it depends on what exactly we are measuring and how exactly we measure it.
Specificity of Reliability
When performing a vertical jump on a force plate, our software collects different data points as often as 1000 times per second. That is an extremely large amount of data taken from such a simple test. Utilizing these data points we can capture a variety of different measures throughout different time points (peak power, rate of force production, flight time, take-off velocity, etc). It is critical to understand that just because we believe the vertical jump is a reliable test and force plates are reliable tools, not all of these measures are inherently reliable. While this concept seems obvious it is far too often ignored.
As we get more granular with data collected, it is critical to evaluate the reliability of each of the different measures we are hoping to use. If the data we are collecting isn't reliable, there is no tool, software, or algorithm we can use to make it reliable; we are simply collecting bad data. The saying that statisticians and data scientists often use is "Garbage in, garbage out," and while it may seem a bit harsh it is reality. Bad data can be extremely dangerous and cause us to make poor decisions off of inaccurate information. No data is better than bad data.
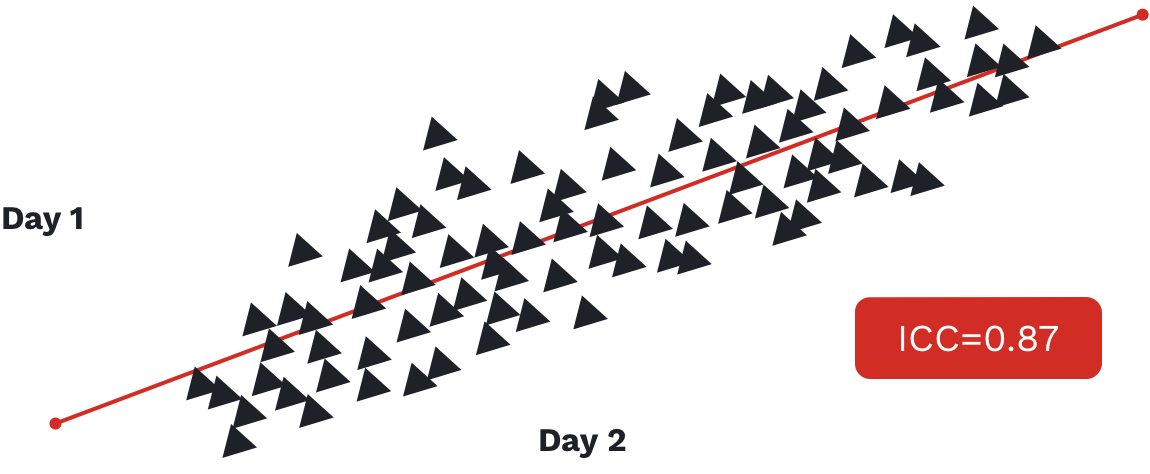
The above example is taken from a 2011 paper investigating the reliability of three different devices when measuring the vertical jump (2). According to the study, all three devices tested showed good reliability (ICC > 0.80). This is good news for both the vertical jump and the devices utilized in the study. But we also need to be careful here as this research paper does NOT "prove" that in turn, any measurement we can derive from the vertical jump is automatically reliable. Reliability is specific and as such needs to be evaluated independently across any and all types of data one is collecting.
A 2019 paper by Carroll et al. examined the reliability of the vertical jump utilizing a force plate (3). This paper is looking not only at the jump height (as in the previous paper) but also look at some "alternative" variables that can be derived from the vertical jump when utilizing force plates. The variables utilized are countermovement jump height, modified reactive strength index (RSI-mod), relative peak power, and countermovement depth. As we might expect, this paper is consistent with the previous paper stating the jump height variable is reliable. RSI-mod is a calculated variable that is partially derived using the jump height variable; the ratio of jump height to time to take-off. Partially because of this we are not surprised to see RSI-mod report sufficient reliability as well. However, if we look at both the relative peak power and countermovement depth variables when evaluated inter-session (reliability between multiple sessions or test-retest) we see ICC values of 0.41 and 0.39 respectively. Well below our cutoff of acceptable at 0.50. This is a great example of the specificity of reliability, and a true case study for showing the importance of not only assessing the reliability of the assessments (jumping) or devices (force plate, Vertec, jump-map, etc) but also each specific variable or data-point that we are able to utilize.
Typical Error
At the most basic level, assessing the reliability of your data is critical for understanding what you can actually use and what ends up being just bad data. The next step is understanding what is called the Typical Error which in turn, allows us to understand when there is an actual worthwhile or meaningful change. When assessing our athletes, soldiers, clients, or patients, it is important to know what is considered a meaningful change, compared to what may just be normal fluctuations in the test or the person. To keep our example simple utilizing the vertical jump height, if an individual increases their jump height by .64 inches we must ask if this a significant change or not. Is this simply within the normal variation or we can confidently say the individual is jumping higher than before?
The Typical Error is the random variation that occurs from one measurement to another which can result from both technological error (from the testing device) or biological variation (normal human variability). To stick with our simplest example of body weight, we can utilize the two measures from our test-retest experiment above:
- Day 1: 220.8 lbs
- Day 2: 222.1 lbs
As mentioned before, a reliable scale should give us a similar value each time we step on it. But because of this "error," it might not be exactly the same (and that can be ok!). Defining the typical error allows practitioners to separate what is significant from what is simply noise. For example, an inexpensive or poor quality scale may suffer from technological error simply because of low-quality construction or components. If we don't account for this error we are unable to know if the change in weight above of 1.3 lbs (222.1-220.8) is a real change or not. This scale could even suffer from what we might call non-uniform error or heteroscedasticity, meaning that the scale is actually more and less inaccurate at different weights. This can be a big problem as it may mean the reliability isn't consistent across multiple populations.
Normal biological variation can also be a source of error. A normal person's body weight can fluctuate even 2-3% in a single day. So even a 5 or 6 lbs increase or decrease in body weight for our 220 lbs individual could simply be due to our typical error! As you can see, understanding this typical error is extremely important in being able to evaluate reliability and determine significant change.
Smallest Worthwhile Change
A common calculation utilized to allow practitioners to quickly and simply understand what constitutes a significant change is called the Smallest Worthwhile Change (SWC). This is simply based on effect sizes, and is calculated by multiplying the standard deviation of our data set by 0.2. The concept is that if this SWC is greater than our Typical Error, we can state that the change is a real change and not simply due to error. The smallest worthwhile change isn't the only tool to identify effect sizes but is worth a mention as it has become a commonly utilized tool and is often a question from practitioners.
Conclusion:
No data is better than bad data, and bad data is unreliable data. It is often assumed that new technologies are inherently reliable and scientific purely because they are digital, wireless, or sleek, but that is often not the case. Reliability analyses are often ignored as they aren't exciting, but the very first question that needs to be asked when looking to collect data: is this data reliable?
References:
- Gribble PA, Brigle J, Pietrosimone BG, Pfile KR, Webster KA. Intrarater reliability of the Functional Movement Screen. J Strength Condit Res. 2012;26(2):408‐415.
- Nuzzo JL1, Anning JH, Scharfenberg JM. The reliability of three devices used for measuring vertical jump height. J Strength Cond Res. 2011 Sep;25(9):2580-90.
- Carroll, Kevin M., et al. "Intrasession and Intersession Reliability of Countermovement Jump Testing in Division-I Volleyball Athletes." The Journal of Strength & Conditioning Research 33.11 (2019): 2932-2935.